Water Quality
|
PLEASE DO NOT SHAMPOO OR USE SOAP IN THE LAKE. Phosphates encourage algae growth which can destroy our clear water. Try to purchase phosphate-free soaps, dishwasher soap, and laundry detergent.
The lake water is not safe to drink unless treated with an ultraviolet (UV) or reverse osmosis (RO) system. Well Water/Treated Lake Water Testing: Consider having your well water or treated lake water tested regularly. It is recommended to test it multiple times (at least 3 times) spaced about 2 weeks apart over the course of the summer. Well water testing is provided FREE OF CHARGE by the Ministry of Health, through their locations in Renfrew, Pembroke, and Arnprior. It is simple to test and drop off the water sample, and results are typically received within 10-15 days. All property owners utilizing well water or treated lake water as a source of drinking water or washing are urged to participate in this program. Renfrew County and District Health Unit https://www.rcdhu.com/healthy-living/safe-water/ 1-800-267-1097 or (613) 732-8654 Swimmers Itch Fact Sheet:
Lake Clear has periodically encountered swimmer’s itch (formerly called the Golden Lake Itch). Here is an informative fact sheet that talks about how to avoid this little varmint.
|
Ontario Ministry of the Environment and Climate Change June 2018 Presentation to BVT Council:
In 2018, the LCPOA encouraged BVT Council to request a presentation from a MOECC scientist regarding the state of Lake Clear’s water quality and the impact of development, including the use of Recreational Vehicles. This was intended to educate Council members, prior to the June 2018 public consultation, on the unregulated use of RVs on lakefront properties. Following is the PowerPoint presentation by Victor Castro, Team Leader, Surface Water for Eastern Ontario.

| ||||
Lake Clear Water Quality
This information was provided by the LCPOA Environment Committee, August 2021.
WATER QUALITY TESTING
Introduction
The LCPOA, specifically the Lake Steward function, has been engaged for over 20 years with the Lake Partners initiative of the Ministry of the Environment, Conservation and Parks (MECP). This initiative monitors and analyzes the annual water tests that are submitted by lake steward volunteers sampling thousands of lakes throughout Ontario. The data collected is entered into a database at MECP. Analysis of the data over a long period of time is intended to identify trends in water quality changes.The following information has been extracted from a variety of websites; principally, the MECP Lakeshore Capacity Assessment Handbook and the websites for both MECP and MNRF.
There are a number of measurements that determine the health of a water body. The Lake Steward takes some of these measurements annually (usually around the May long weekend) and others are taken periodically by the MECP.
The Lake Steward’s water sampling is specifically for Total Phosphorus (TP) content and water clarity (Secchi Disk).The remaining sampling tests are performed by MECP directly. Those are Alkalinity, pH, Dissolved Oxygen (DO) and Dissolved Calcium (DC).
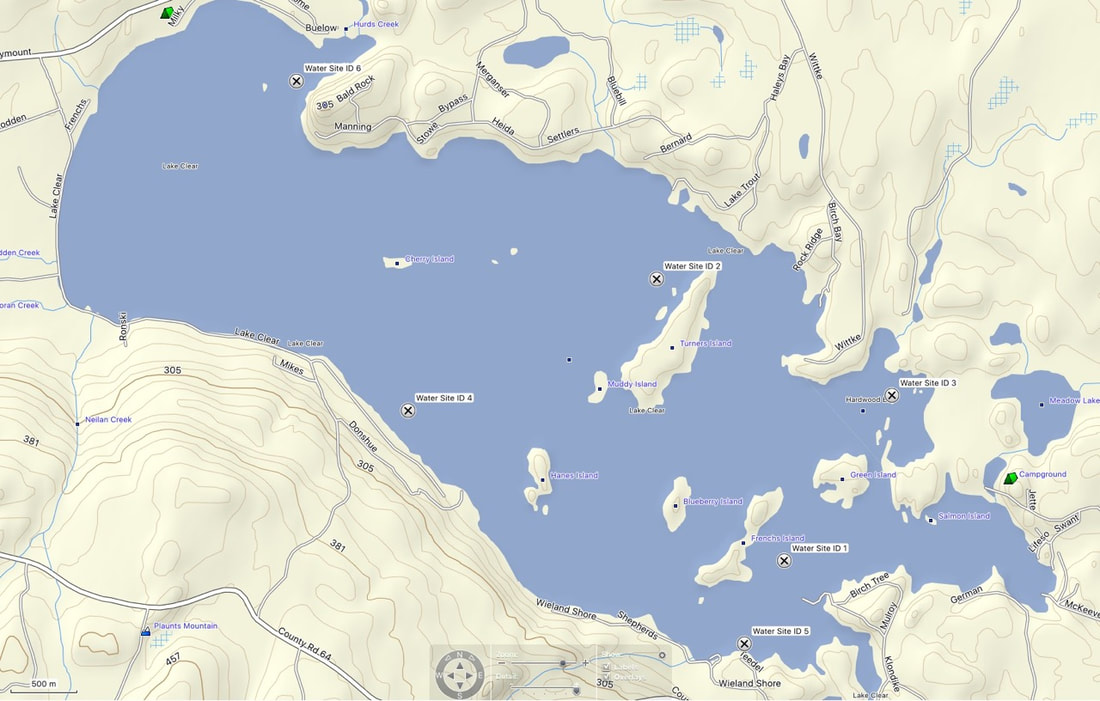
There are 6 test sites around the lake as described in the table below. A map is also provided to show the precise locations.
Introduction
The LCPOA, specifically the Lake Steward function, has been engaged for over 20 years with the Lake Partners initiative of the Ministry of the Environment, Conservation and Parks (MECP). This initiative monitors and analyzes the annual water tests that are submitted by lake steward volunteers sampling thousands of lakes throughout Ontario. The data collected is entered into a database at MECP. Analysis of the data over a long period of time is intended to identify trends in water quality changes.The following information has been extracted from a variety of websites; principally, the MECP Lakeshore Capacity Assessment Handbook and the websites for both MECP and MNRF.
There are a number of measurements that determine the health of a water body. The Lake Steward takes some of these measurements annually (usually around the May long weekend) and others are taken periodically by the MECP.
The Lake Steward’s water sampling is specifically for Total Phosphorus (TP) content and water clarity (Secchi Disk).The remaining sampling tests are performed by MECP directly. Those are Alkalinity, pH, Dissolved Oxygen (DO) and Dissolved Calcium (DC).
There are 6 test sites around the lake as described in the table below. A map is also provided to show the precise locations.
Test Site # |
Site Location |
GPS Coordinates |
Lake Steward |
3 |
Hardwood Bay |
45° 26.251’N 77°09.478’W |
Wayne Lecuyer |
1 |
E. End Centre |
45° 25.581 ’N 77° 10.138' W |
Anita Netherton/Larry Wong |
4 |
South Centre Mulberry LN |
45 °26.190 ’N 77°12.432’W |
Wayne Lecuyer |
2 |
N. End Feather Island |
45° 26.725’N 77°10.916’W |
Brian Thurgood |
5 |
South East End Wieland Shore |
45° 25.244’ N 77° 10.378’W |
Doug Davies |
6 |
Lornie Foran Island & Big Rock Area |
N45° 27.528’ W77°13.110’ |
Brian Thurgood |
For more detail, please click on the headings below.
Nutrients, such as nitrogen and phosphorus, are essential for plant and animal growth and nourishment, but the overabundance of certain nutrients in water can cause several adverse health and ecological effects.
Phosphorus (P) is a common constituent of agricultural fertilizers, manure, and organic wastes in sewage. It is an essential element for plant life, but when there is too much of it in water, it can speed up eutrophication (a reduction in dissolved oxygen in water bodies caused by an increase of mineral and organic nutrients) of rivers and lakes. Soil erosion is a major contributor of phosphorus to streams. Bank erosion occurring during floods can transport a lot of phosphorous from the riverbanks and adjacent land into a stream, lake, or other water body.
The phosphorus concentration of a lake is one measure (<10 µg/L) of the desirable attributes we wish to protect as the lake’s shoreline is developed. These attributes include clear water for recreation and a well-oxygenated habitat for cold-water fish.
The main human sources of phosphorus to many of Ontario’s recreational inland lakes are sewage systems from houses and cottages. Clearing the shoreline of native vegetation, use of fertilizers, storm water runoff and increased soil erosion also can contribute significant amounts of phosphorus to a lake.
To avoid nuisance concentrations of algae in lakes, average total phosphorus (TP) concentrations for the ice-free period should not exceed 20 µg/L. A high level of protection against aesthetic deterioration will be provided by a total phosphorus concentration for the ice-free period of 10 µg/L or less. Unfortunately annual averages do not take into account maximum levels of phosphorus, which are usually reached in the spring and fall. This is when algae growth could commence even though Lake Clear average TP levels are in an acceptable range.
For Ontario's inland lakes on the Precambrian Shield, trophic (nutrient) status is determined by the level of total phosphorus (TP) in the water, as indicated in the table below.
Trophic status |
Total Phosphorus range (µg/L) |
Meaning |
Oligotrophic |
<10 |
Provides a high level of protection against aesthetic deterioration |
Mesotrophic |
10-20 |
Avoid nuisance concentrations of algae |
Eutrophic |
>20 |
Will promote excessive plant growth |
TESTING RESULTS
TOTAL PHOSPHORUS (GOAL <20 µg/L)
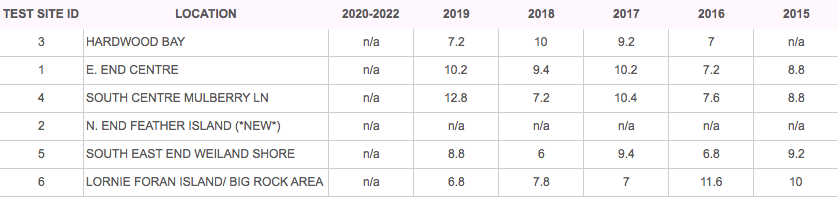
Note: Lake Clear does not have an abundance of algae and is considered to be oligotrophic.
Water clarity is an obvious feature of surface waters and is an important indicator of waterbody health. Water clarity is important for several reasons. It affects the depth to which aquatic plants can grow, dissolved oxygen content, and water temperature. Suspended sediments, algal growth, runoff, shoreline erosion, wind mixing of the lake bottom can all affect water clarity.
Secchi disk measurements indicate the depth at which a lake has enough sunlight to support plant life. The general rule is that sunlight can penetrate the water about 1.7 times the depth of a Secchi disk reading. Thus, if the Secchi reading is 10 feet, the sunlight can penetrate the water to about 17 feet deep.
Water clarity can fluctuate quite a bit over the course of a year or over a period of years. This fluctuation can result from natural phenomena, such as flooding, drought, seasonal winds and temperatures, species introduction (e.g. Zebra mussels), pollution and dredging. Therefore, long-term monitoring is very important in understanding the dynamics of waterbodies.
The Ministry of the Environment, Conservation and Parks provides the following guidelines for water clarity:
Quality |
Metres |
Excellent |
7.3 m – 12m |
Good |
3.7m – 7.3m |
Poor |
0m – 3.7m |
TESTING RESULTS
WATER CLARITY (GOAL 3.7 – 12m)
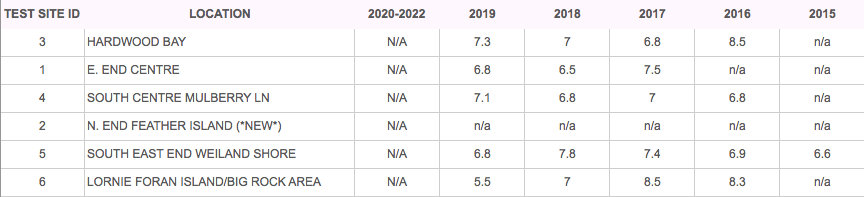
Lake Clear, as the name denotes, has always had very good water clarity. The presence of Zebra mussels in Lake Clear may result, over time, in increased water clarity as the adult Zebra mussels filter plankton and algae from the water. Unfortunately, these invasive mussels then excrete the phosphorous from their food as dissolved P and concentrate it by the shorelines where they live; creating favourable conditions for excessive plant growth and algae blooms even though the lake’s total phosphorous levels remain the same.
Dissolved oxygen (DO) is a measure of the amount of oxygen available to living aquatic organisms. The amount of dissolved oxygen in a lake can tell us a lot about its water quality.
Although water molecules contain an oxygen atom, that oxygen is not what is needed by aquatic organisms living in natural waters. A small amount of oxygen, up to about ten molecules of oxygen per million of water, is actually dissolved in water.
Dissolved Oxygen, Temperature, and Aquatic Life
All forms of aquatic life use dissolved oxygen in surface water; therefore, this constituent typically is measured to assess the "health" of lakes and streams. Oxygen enters a stream from the atmosphere and from groundwater discharge. Photosynthesis is the primary process affecting the dissolved oxygen/temperature relation; water clarity and strength and duration of sunlight, in turn, affect the rate of photosynthesis.
The concentration of dissolved oxygen in surface water is affected by temperature and has both a seasonal and a daily cycle. Cold water can hold more dissolved oxygen than warm water. In winter and early spring, when the water temperature is low, the dissolved oxygen concentration is high. In summer and fall, when the water temperature is high, the dissolved oxygen concentration is often lower. Conditions may become especially serious during a period of hot, calm weather, resulting in the loss of many fish.
The provincial Ministry of Natural Resources and Forestry (MNRF) has determined that the minimum amount of dissolved oxygen concentration necessary to sustain a lake trout population is 7 mg/L.
For Lake Clear, the oxygen concentration was measured at 4.59 mg/L.
This determined the lake’s status, as a lake trout lake, and resulted in the lake being classified as being ‘at capacity”.
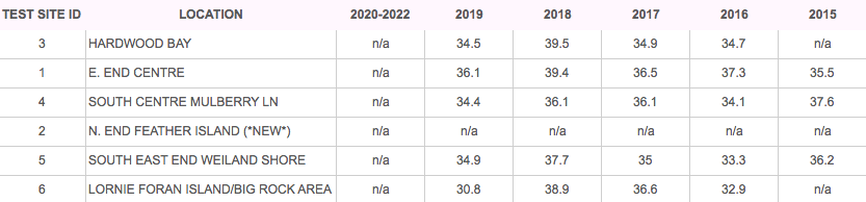
Dissolved Calcium
Calcium is naturally present in water. It may dissolve from limestone, dolomite, and marble rocks, as well as minerals such as calcite, gypsum, fluorite and apatite. Calcium is a main determinant of water hardness.
Dissolved Calcium in Lake Clear has been measured as an average of 37mg/L over the last 10 years. This level is surprisingly high for a Precambrian Shield lake. This level contributes to the alkalinity level in the water, which serves as a buffer against acid.
It also, unfortunately, provides the calcium needed by Zebra mussels to form their shells and thrive in our lake.
TESTING RESULTS
DISSOLVED CALCIUM (GOAL > 20 mg/L)
|
Anyone who has ever owned and maintained a backyard swimming pool understands the importance of checking and maintaining a proper pH level. Left unchecked and untreated, the pool rapidly turns green, then slimy. Now, on a whole different scale, apply that same thinking to Lake Clear. Unfortunately, at the lake, we don’t have the benefit of dumping chemicals into the water to maintain the alkalinity level – that is nature’s job, but it is important for us to measure the values consistently and understand the changes over a longer period.
Alkalinity is not a chemical in water, but, rather, it is a property of water that is dependent on the presence of certain chemicals in the water, such as bicarbonates, carbonates, and hydroxides. A definition of alkalinity would then be "the buffering capacity of a water body; a measure of the ability of the water body to neutralize acids and bases and thus maintain a fairly stable pH level.
|
|
In more simple terms, water with a high alkalinity will experience less of a change in its own acidity, for instance, when acidic water, such as acid rain, is introduced into the water body.
Why alkalinity is important
Although you don't often hear about the alkalinity of your lake in the news, alkalinity can be important to the health and welfare of a lake.
Water bodies can be subjected to sudden inputs of chemicals, such as those contained in acid rain and wastewater that can cause rapid changes in the acid/base balance of a lake—lowering the pH of the lake water. A sudden shift in pH is not healthy for the fish and organisms living in the water. Aquatic organisms benefit from stable pH values, and waters with a high alkalinity are better able to maintain a constant pH.
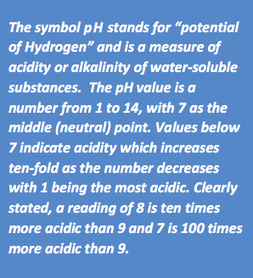
When thinking about water quality, alkalinity is much more important measurement than pH itself. pH tells you whether the water is acidic, neutral or basic, but not the buffering capacity of the water. Buffering capacity is the ability of water to resist a change in pH; alkalinity tells you the buffering capacity within the pH range of the water.
For the protection of aquatic life, the alkalinity (buffering capacity of a lake) should be at least 20 mg/L. The typical range of alkalinity in surface water is 20 mg/L - 200 mg/L and waters with a higher alkalinity are better able to maintain a fairly constant pH.
The Canadian Council of Ministers of the Environment (CCME) Water Quality Guidelines for the protection of aquatic life has a pH exposure guideline range of 6.5 to 9. The data in the table below shows that Lake Clear has a pH within CCME guideline values with a moderate ability to buffer changes in pH, given its alkalinity range.
Why alkalinity is important
Although you don't often hear about the alkalinity of your lake in the news, alkalinity can be important to the health and welfare of a lake.
Water bodies can be subjected to sudden inputs of chemicals, such as those contained in acid rain and wastewater that can cause rapid changes in the acid/base balance of a lake—lowering the pH of the lake water. A sudden shift in pH is not healthy for the fish and organisms living in the water. Aquatic organisms benefit from stable pH values, and waters with a high alkalinity are better able to maintain a constant pH.
When thinking about water quality, alkalinity is much more important measurement than pH itself. pH tells you whether the water is acidic, neutral or basic, but not the buffering capacity of the water. Buffering capacity is the ability of water to resist a change in pH; alkalinity tells you the buffering capacity within the pH range of the water.
For the protection of aquatic life, the alkalinity (buffering capacity of a lake) should be at least 20 mg/L. The typical range of alkalinity in surface water is 20 mg/L - 200 mg/L and waters with a higher alkalinity are better able to maintain a fairly constant pH.
The Canadian Council of Ministers of the Environment (CCME) Water Quality Guidelines for the protection of aquatic life has a pH exposure guideline range of 6.5 to 9. The data in the table below shows that Lake Clear has a pH within CCME guideline values with a moderate ability to buffer changes in pH, given its alkalinity range.
pH and Alkalinity in Lake Clear
Parameter |
29 May 2003 |
5 Sept 2003 |
16 Sept 2010 |
17 May 2011 |
12 Sept 2011 |
22 May 2018 |
25 Sept 2018 |
Total Alkalinity (mg/L) |
120 |
108 |
106 |
113 |
105 |
109 |
99.1 |
pH |
8.01 |
8.41 |
8.36 |
8.57 |
8.38 |
8.22 |
8.28 |
The values for Lake Clear are in a range from 99 mg/L to 120 mg/L, which is within the typical range for surface water.

|

|